
Carbon Monitoring
What do the carbon numbers mean, and how are they calculated?

Live Grid Emissions panel
If you want to understand the carbon costs of your charging, the first place to look is beneath the charger status information on the Evnex app. Here you will find the Live Grid Emissions panel, which tells you information about the electricity currently available from the grid where your charger is connected.
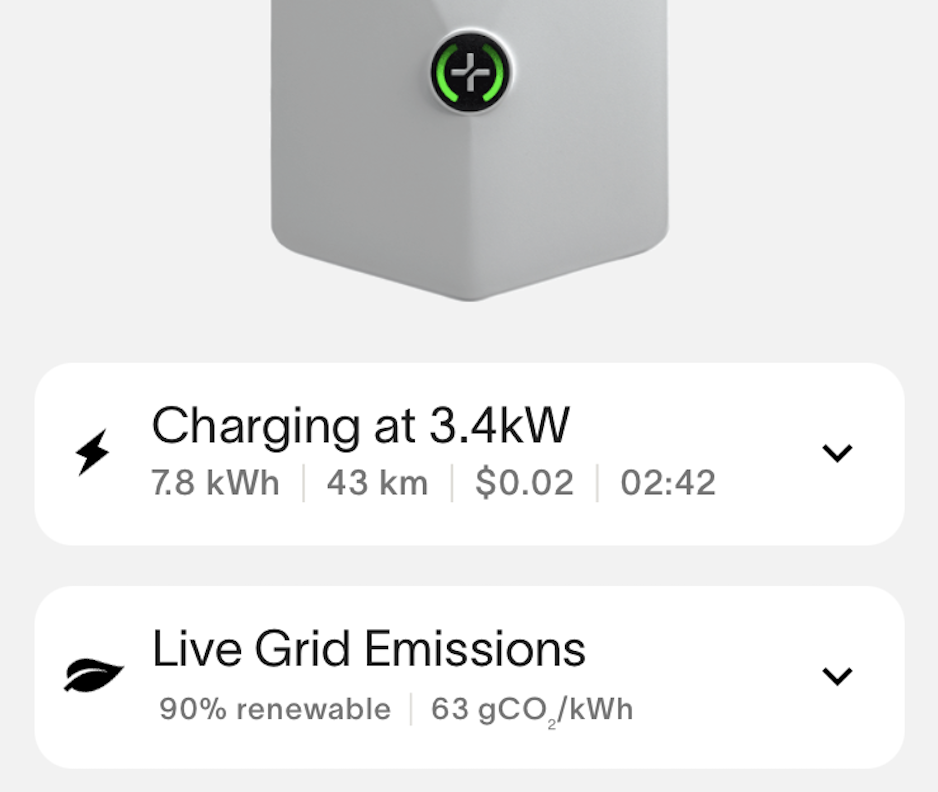
The Live Grid Emissions panel on the charger home page
% Renewable
The first number shows what percentage of the electricity on your local grid is being generated from renewable energy sources (including Hydro, Wind, Geothermal, and Solar). This number will fluctuate to varying degrees depending on factors like your location, weather, and local electricity demand.
While New Zealand obtains much of its energy from renewable sources, these can still vary depending on the season. In Australia, these differences can be more pronounced in some regions across a 24-hour period. Planning to charge at times of high percentage of renewable energy can really help to lower your carbon impact over time.
CO₂ emitted per kWh
A more specific metric is visible in the second figure, which shows how many grams of carbon dioxide are currently being emitted to supply each kWh of energy. The renewable percentage doesn't quite tell the whole story, since different energy sources produce differing amounts of carbon. Coal is the worst, producing 820 g/kWh, with gas significantly cleaner at 490 g/kWh. So the grid may actually be cleaner when there is 85% renewable with the remainder supplied from gas, than it is at 90% renewable with the remainder coming from coal.
Carbon Intensity
Expanding the information panel reveals a pair of graphs which provide a little more of the context of the headline numbers.
The top graph shows how the rate of emissions has varied over the previous 24 hours. Some days will show more variation than others, but generally speaking the grid is at its cleanest at the same time each day (with some seasonal variation). If you can set your charging schedule to times when emissions are in the lowest part of the range then you will be making the best use of clean sources.
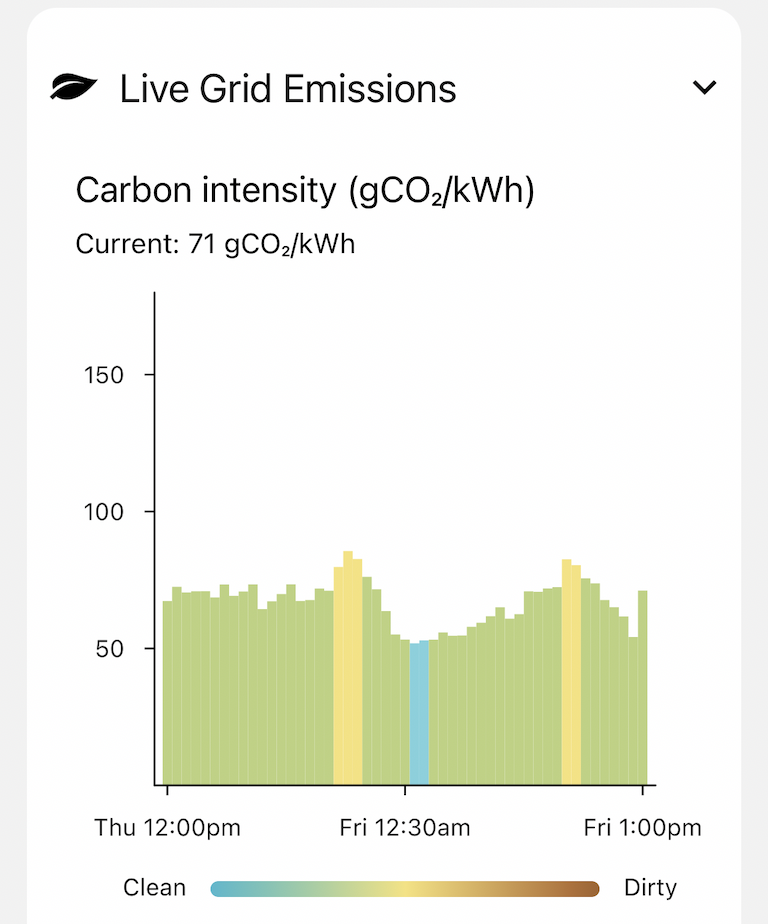
24-hour carbon intensity variation for the New Zealand grid. In this case the cleanest charging schedule to use would be from around midnight to 4am.
Generation Mix
The second graph shows the breakdown of energy sources which have provided electricity to the grid during the last 24 hours. This is where you can find out which non-renewable sources are being used, or see whether there is much generation coming from wind, solar or hydro. In Australia, it is typical for your state to purchase energy from neighbouring states at certain times of day, and this can be seen too.
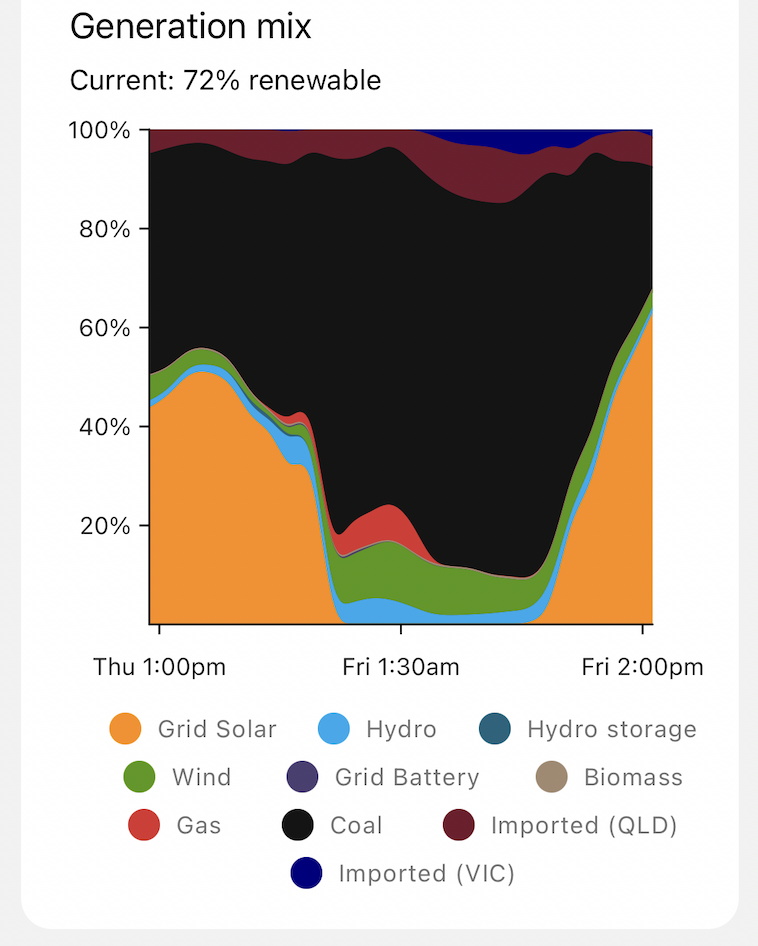
24-hour generation mix for the New South Wales grid. Coal is providing the majority of energy overnight, but in the early afternoon there is a high proportion of solar in the mix, so that would be a clean time to charge.
Charging Emissions
Of course, the live emissions only tell you what's going on now, not what was happening when you charged your car. For that, you'll need to go into the Session History screen from the main page, and find the session you are interested in (this could be the current ongoing session).
Calculations
Every 5 minutes during a charge, we look at the amount of energy that has been consumed from the grid and multiply that by the current carbon intensity to add to the total emissions. In a similar way we record what percentage of that energy came from each generation source, and accumulate these throughout the session. This includes factoring in locally generated solar energy, which we assume to have a carbon intensity of 0 g/kWh.
Carbon emitted per session
In the bottom right of the cell for each session it shows the total amount of carbon emitted in order to provide that energy.
Source of electricity
Tapping a session cell shows various charts related to that session in the top half of the screen. The tab called Gen. Mix shows a stacked chart of the energy sources so you can see what percentage of the electricity came from each different fuel type.
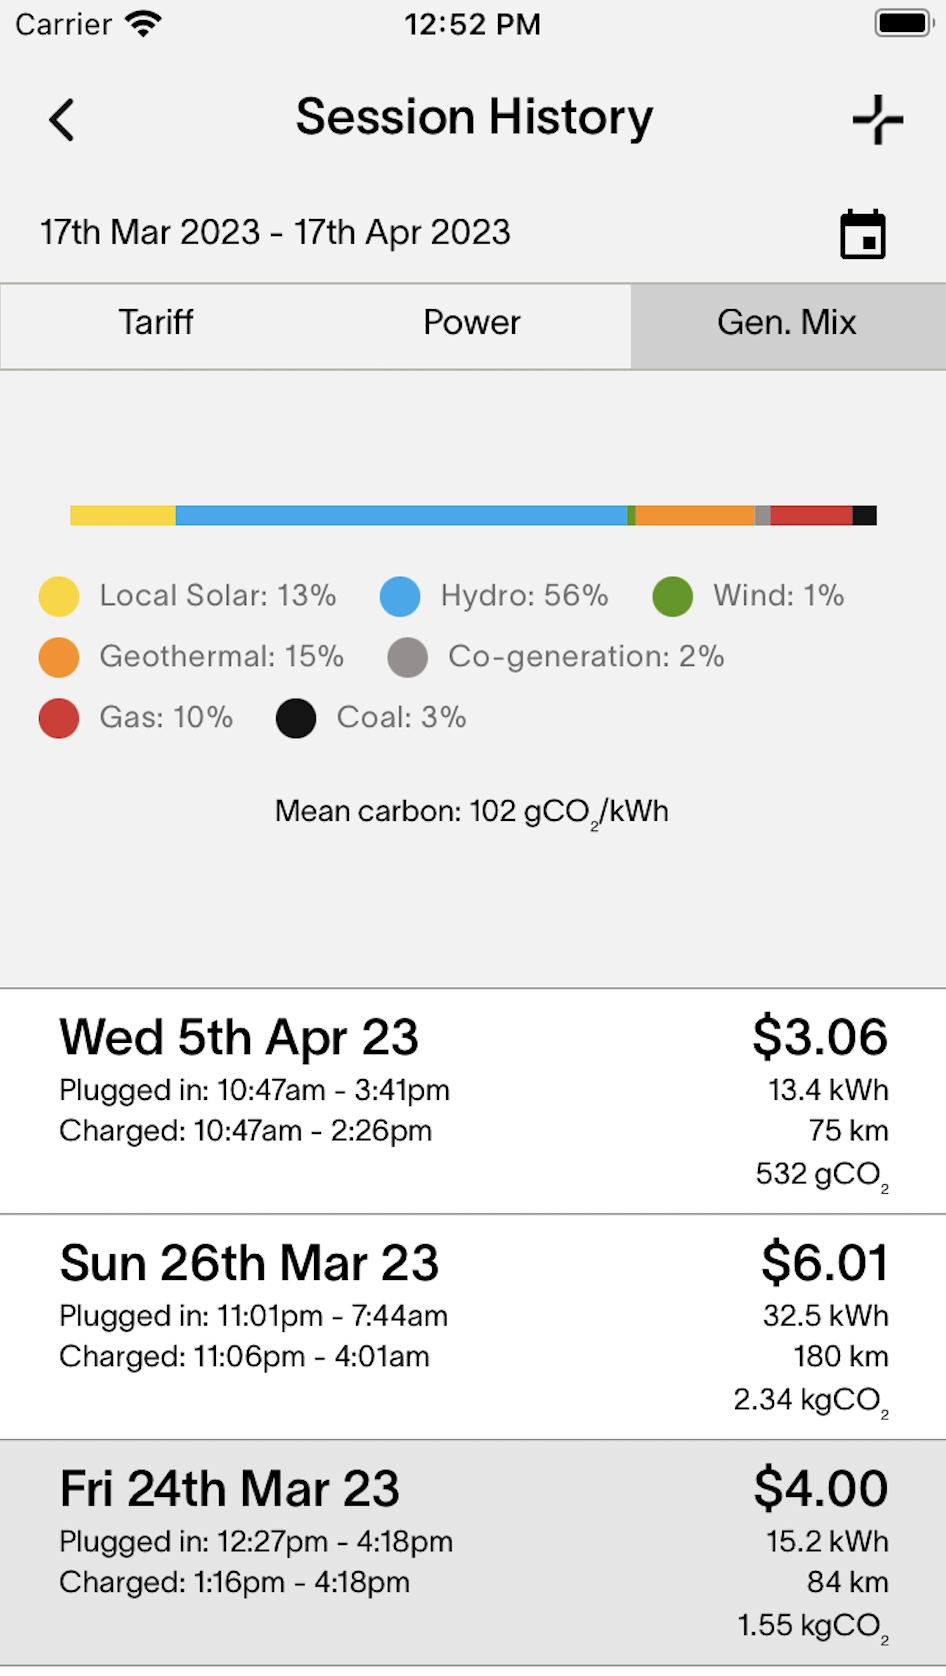
Session History page showing carbon emission details
Full Emission Summary
In a similar vein, the totals from all of the charging sessions in a select period can be found in the Charging Summary screen. Here you can choose a date range, and see the total carbon cost of all charging within that period, plus a stacked chart showing the proportion of energy from each fuel source.
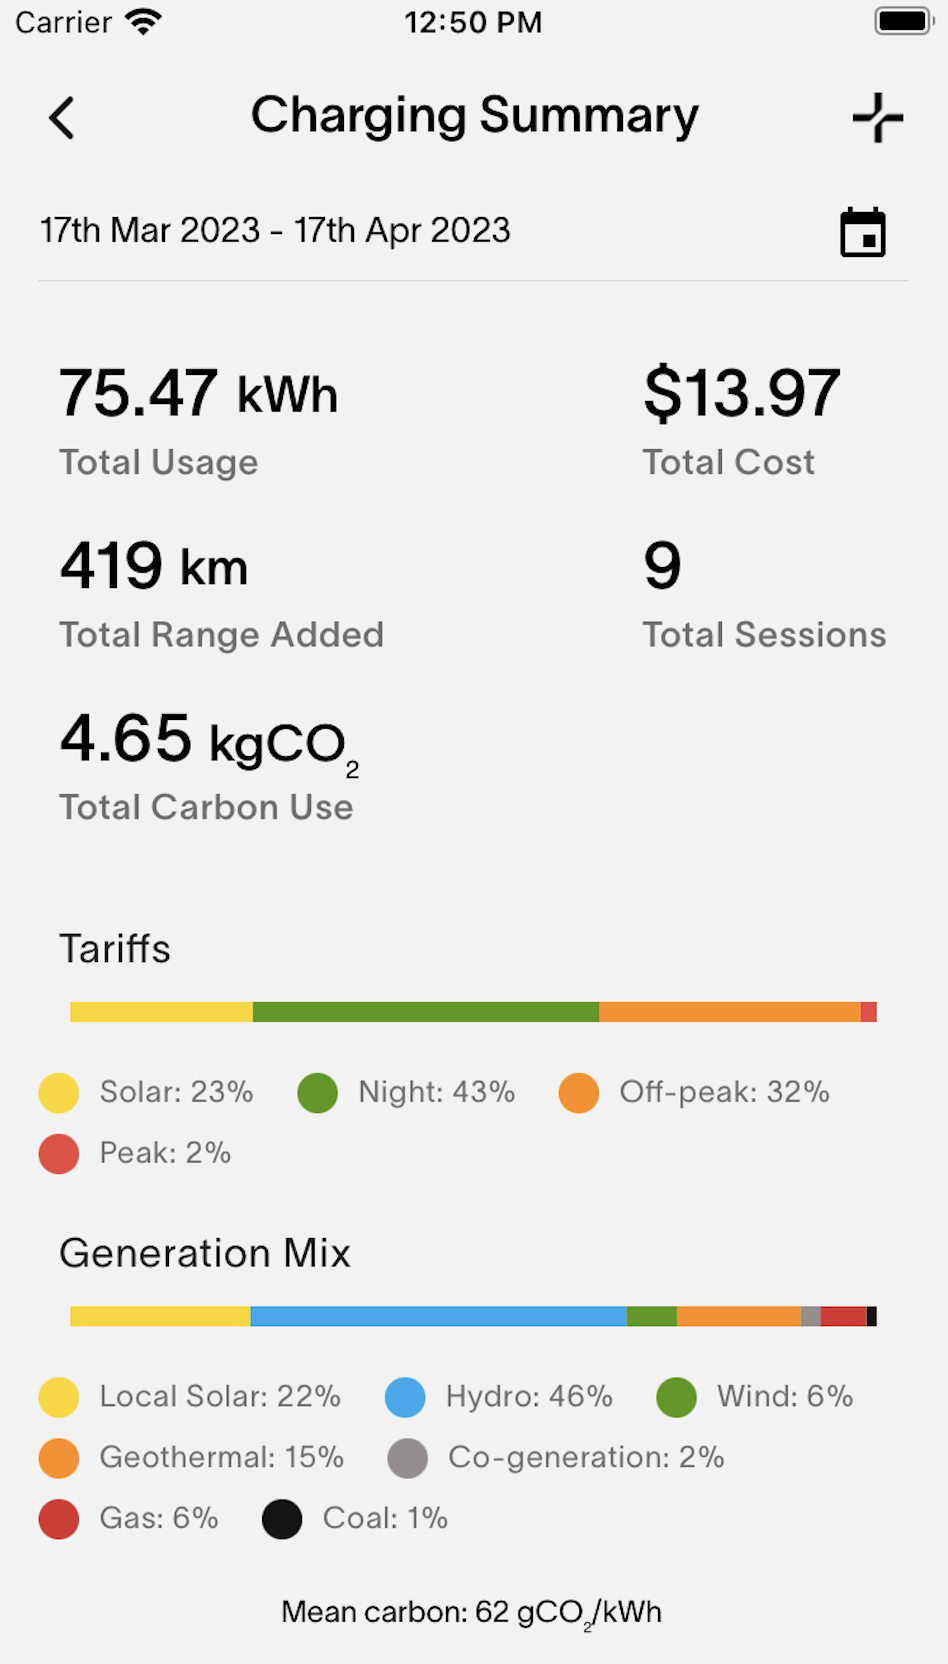
Charging Summary page showing your carbon emission totals
Data Sources
Our New Zealand grid information is sourced from the em6 API available from Energy Market Services (EMS). This is one of the commercial arms of Transpower.
Our Australian grid information is sourced from ElectricityMaps.
Updated 3 months ago